IC Markets Home Sign in Web Trader Contact Us
IC Markets Social IC Markets Social

Information Hub for
Serious Traders

  • ABOUT US
  • OPEN LIVE ACCOUNT
  • OPEN DEMO ACCOUNT
  • TRADE NOW
  • VISIT OUR BLOG
IC Markets Social
  • ABOUT US
  • OPEN LIVE ACCOUNT
  • OPEN DEMO ACCOUNT
  • TRADE NOW
  • VISIT OUR BLOG
March 11, 2024European_Indexes_esIC Markets

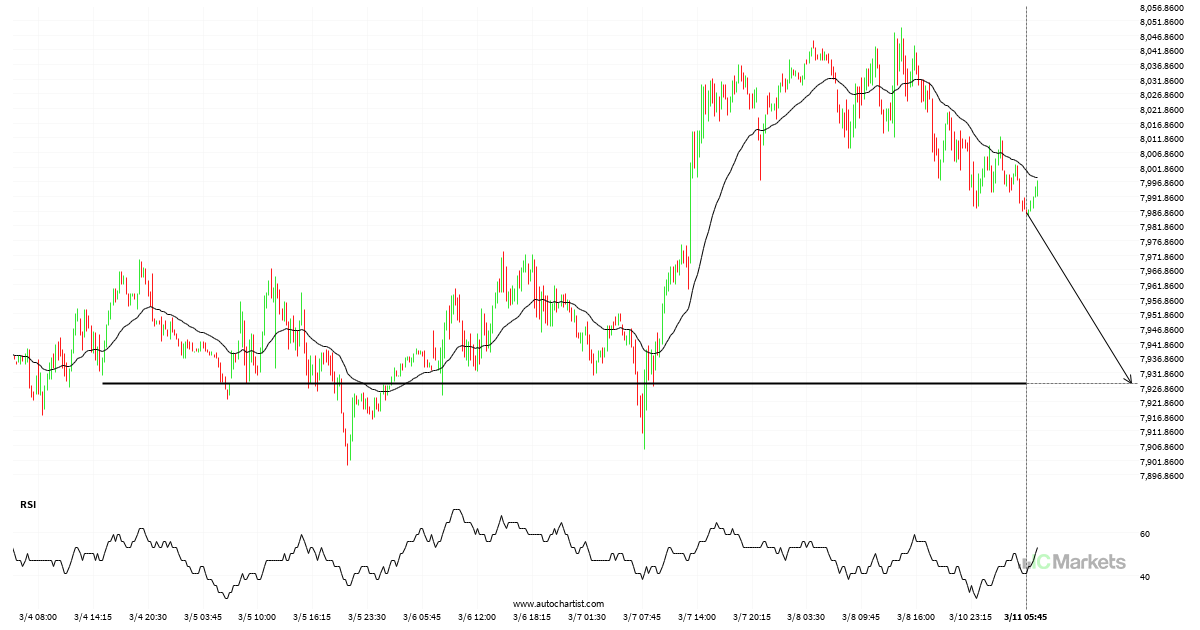
Inminente irrupción de una importante línea de precio del France 40 Index

¡France 40 Index está en camino a una línea muy importante que definitivamente será un factor decisivo de lo que está por venir! Es posible que veamos que esta trayectoria continúa tocando el nivel en 7928.2002 y lo acabe rompiendo, a menos que se quede sin impulso y vuelva a los niveles actuales.

Read more
March 8, 2024European_Indexes_esIC Markets

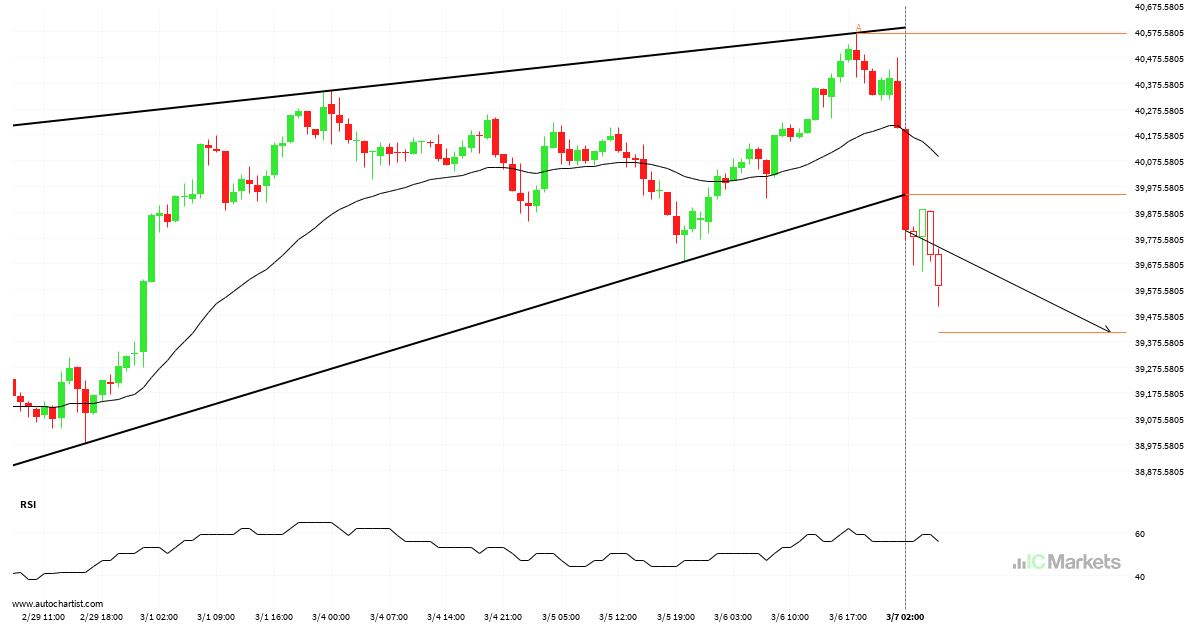
Patrón técnico bajista en Japan 225 Index 30 Minutos

El Japan 225 Index atravesó una línea de soporte. Ha entrado en contacto con esta línea por lo menos dos veces en 2 días. Esta ruptura puede indicar un movimiento potencial a 39429.2815 en 5 horas. Como ya vimos un retroceso de esta posición en el pasado, debemos esperar la confirmación de la ruptura antes […]

Read more
March 7, 2024European_Indexes_esIC Markets

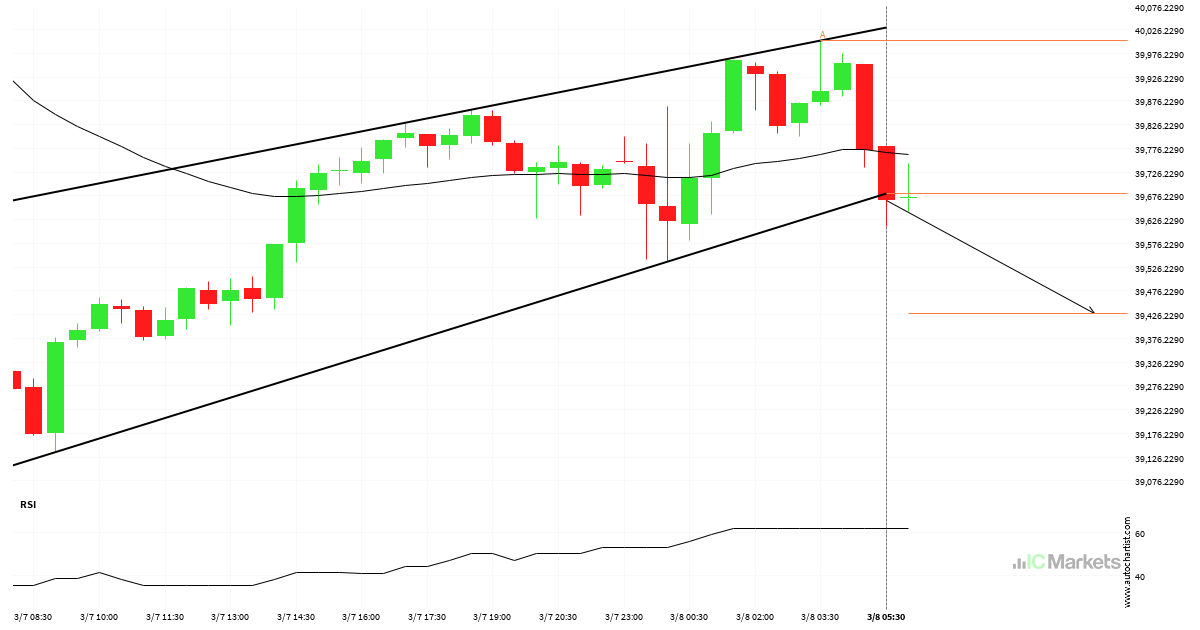
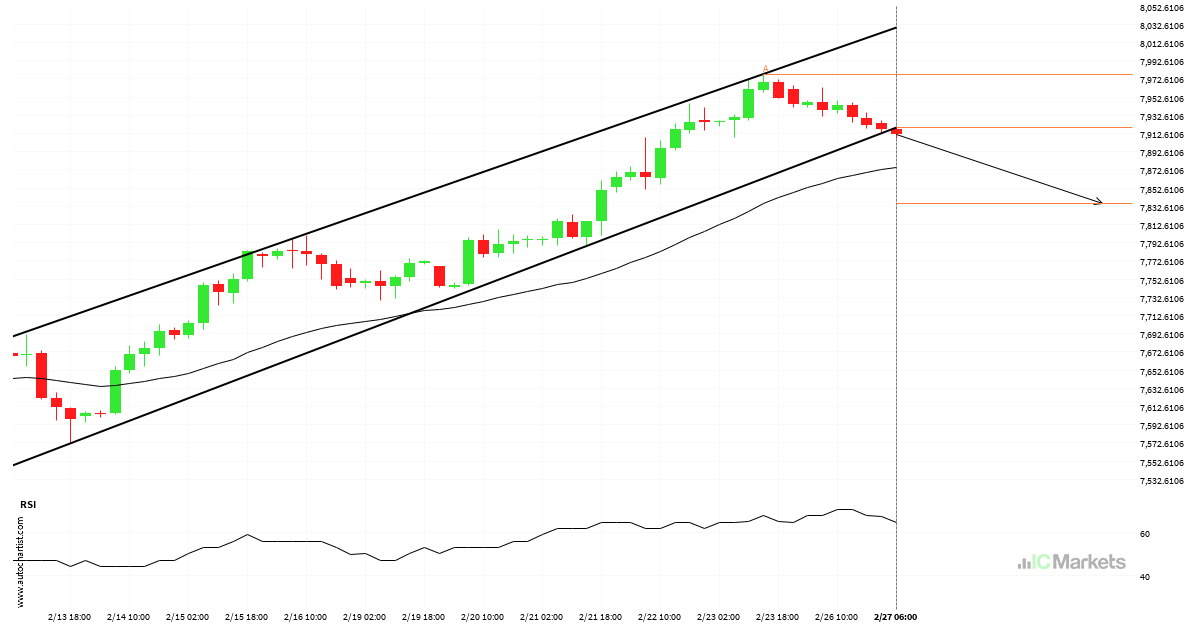
Rotura confirmada en el gráfico de 1 Hora de Japan 225 Index

El Japan 225 Index ha atravesado una línea de soporte de un patrón de gráfico que corresponde a un Cuña ascendente. Si esta irrupción se mantiene, podríamos ver el precio del Japan 225 Index probando el nivel de 39410.1052 dentro de las próximas 2 días. Pero no se apresure si desea operar, porque ya ha […]

Read more
March 5, 2024European_Indexes_esIC Markets

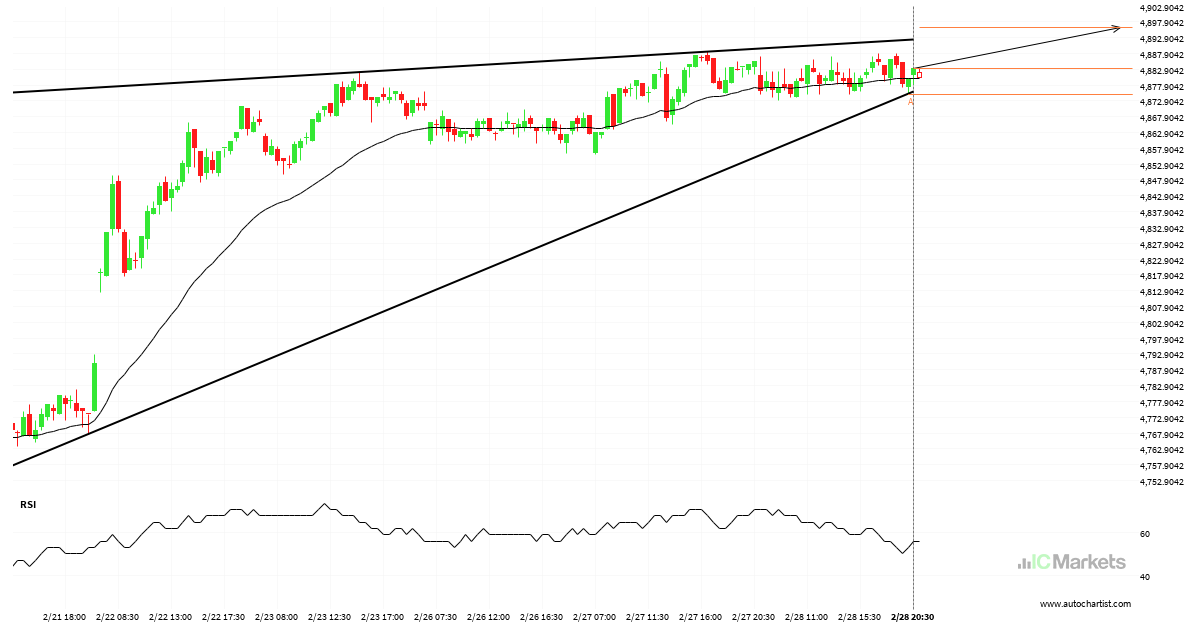
Italy 40 Index – acercándose a la resistencia del Cuña ascendente

El Italy 40 Index avanza hacia la línea de resistencia de un Cuña ascendente, que ya ha probado varias veces en el pasado. Hemos visto un retroceso antes desde esta línea, así que en esta etapa no está claro si atravesará esta línea o se recuperará como lo ha hecho anteriormente. Si el Italy 40 […]

Read more
March 1, 2024European_Indexes_esIC Markets

¿Se espera una tendencia alcista para el UK 100 Index?

El UK 100 Index ha atravesado la línea de resistencia de un patrón de gráfico técnico con un Canal bajista. Como le hemos visto retroceder desde esta posición en el pasado, deberíamos esperar la confirmación de la ruptura antes de actuar. Ha llegado a esta línea dos veces en los últimos 17 días y sugiere […]

Read more
February 29, 2024European_Indexes_esIC Markets

EU Stocks 50 Index – acercándose a la resistencia del Cuña ascendente

El EU Stocks 50 Index avanza hacia una línea de resistencia. Como le hemos visto retroceder desde esta línea anteriormente, podríamos presenciar, o bien, una ruptura a través de esta línea o una recuperación a los niveles actuales. Ha llegado a esta línea en numerosas ocasiones en los últimos 10 días y puede probarla de […]

Read more
February 27, 2024European_Indexes_esIC Markets

France 40 Index – Línea de soporte rota a las 2024-02-27T03:00:00.000Z

Le recomendamos que confirme la rotura que acaba de ocurrir. ¿Cree que el movimiento a través del nivel de soporte es significativo? ¿Tiene indicadores que confirmen que el impulso de los precios continuará? Si es así, busque objetivo en 7835.1542, pero considere reducir el tamaño de su posición a medida que el precio se acerque […]

Read more
February 26, 2024European_Indexes_esIC Markets

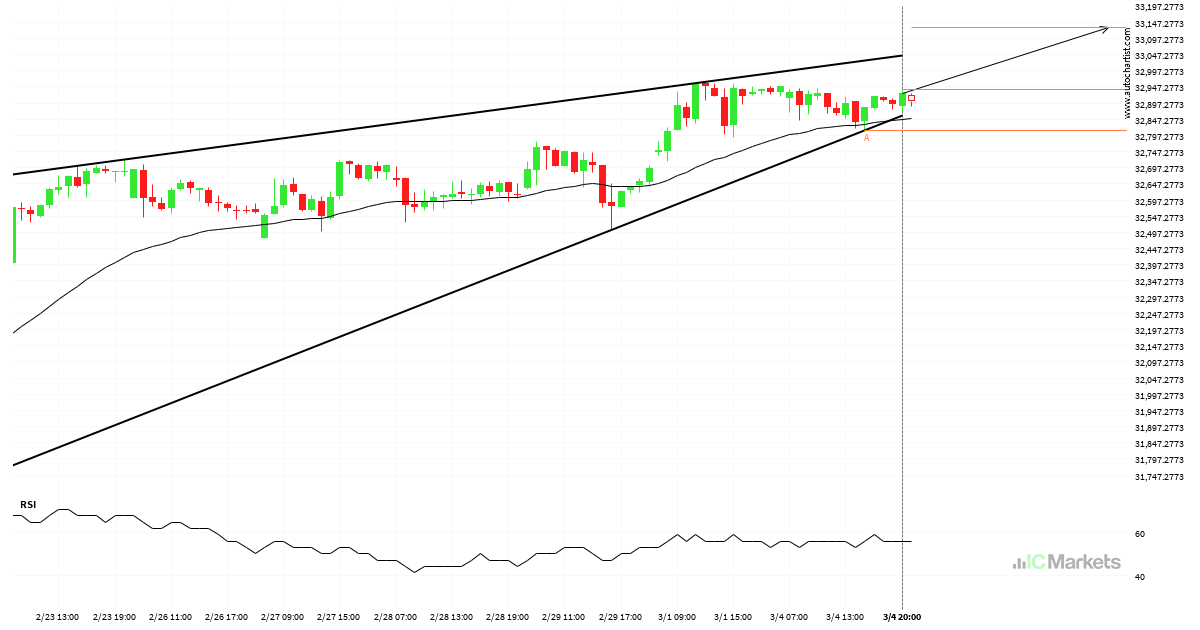
Spain 35 Index – Continuation Patrón de gráfico – Cuña ascendente

Se ha detectado un patrón Cuña ascendente en formación en Spain 35 Index en el gráfico de 4 Hora. Existe la posibilidad de un movimiento hacia 10294.2594 en las próximas velas. Una vez que alcance support, el precio puede continuar su tendencia bullish o revertir a los niveles actuales de precio.

Read more
February 22, 2024European_Indexes_esIC Markets

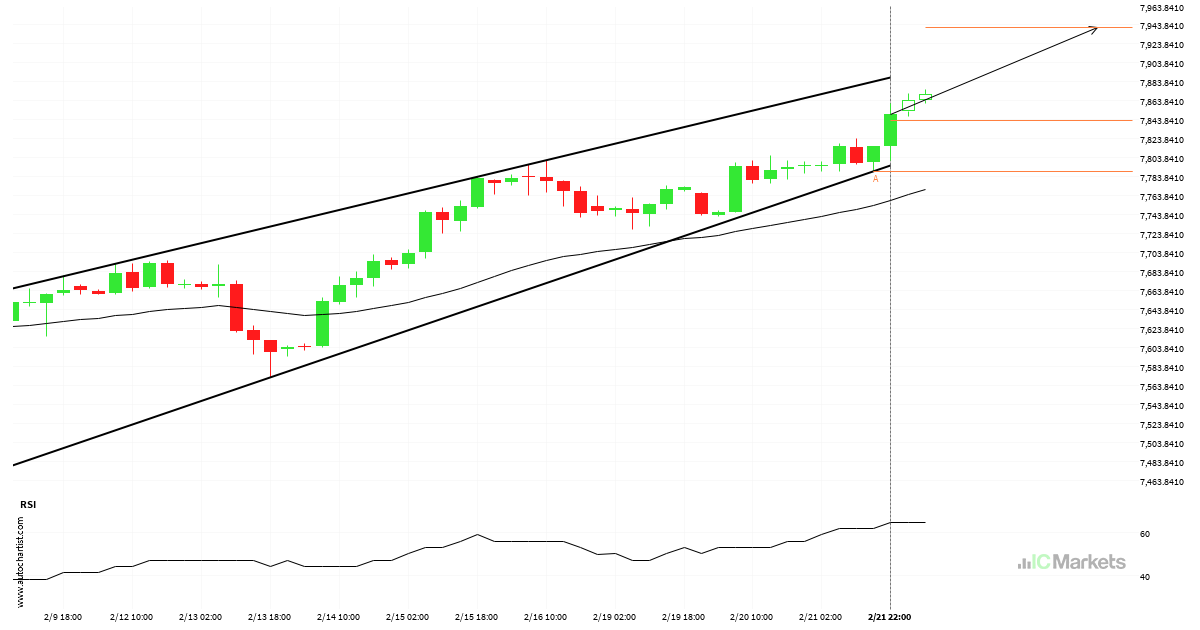
¿Deberíamos esperar una ruptura o una recuperación del France 40 Index?

El patrón de Canal alcista emergente en su ola final se identificó en el gráfico de 4 Hora de France 40 Index. Después de un fuerte movimiento alcista, encontramos que France 40 Index se dirige hacia la línea del triángulo superior con una posible resistencia en 7940.8111. Si resulta que el nivel de resistencia aguanta, […]

Read more
February 20, 2024European_Indexes_esIC Markets

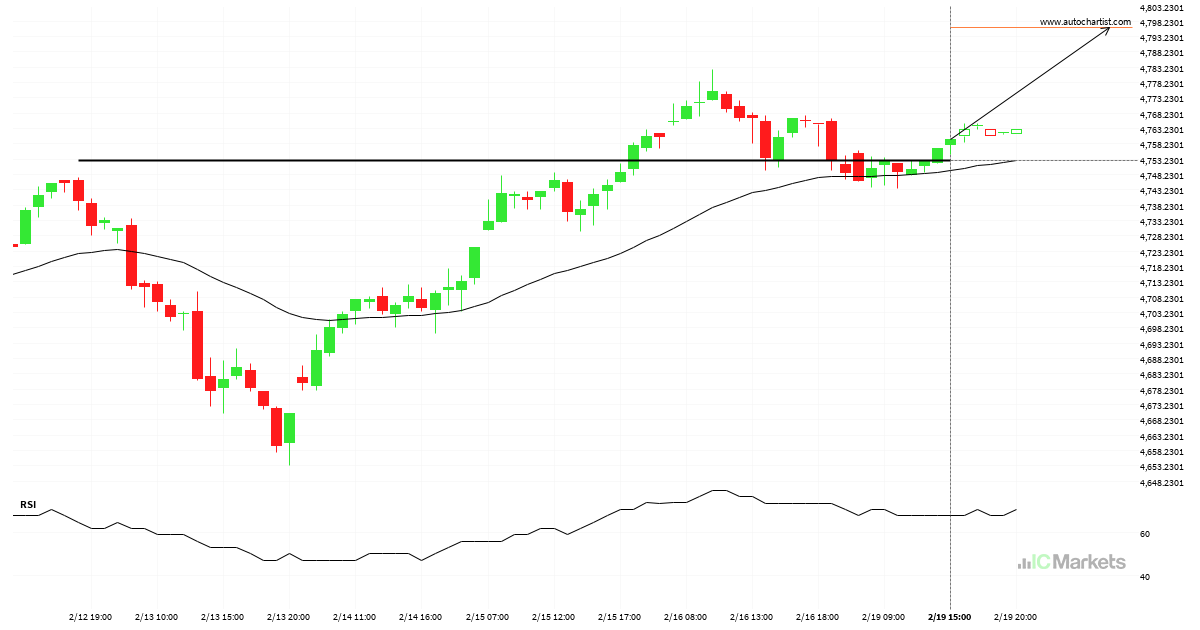
Importante línea de precio atravesada por el EU Stocks 50 Index

Se ha atravesado un fuerte nivel de resistencia en 4752.7998 en el gráfico de 1 Hora de EU Stocks 50 Index. La teoría del análisis técnico pronostica un movimiento a 4796.1001 en el próximo período de 10 Horas.

Read more
  • 1
  • 2
  • 3
  • …
  • 15
  • 16
  • 17
  • 18
  • 19
  • 20
  • 21
  • …
  • 88
  • 89
  • 90

Recent Posts

  • US Dollar vs Swiss Franc – ChartPattern – قناة صاعدة
  • Gold vs US Dollar- KeyLevel – แนวรับ
  • Gold vs Euroymbol – KeyLevel – แนวรับ
  • Gold vs Euro – KeyLevel – مقاومة
  • Gold vs Euro – KeyLevel – مقاومة

Recent Comments

    Translation


     Edit Translation

    Trade with

    a market leader you can rely on

    Open Trading Account Try a Free Demo

    Forex Trading

    • Accounts Overview
    • Open an Account
    • Launch Web Trader

    Trading Specifications

    • Spreads and Commissions
    • Range of Market
    • Trading Hours
    • Funding
    • Withdrawal

    About IC Markets

    • Help Center
    • Why IC Markets
    • Regulation
    • Legal Documents
    • Contact Us


    Forex Trading

    • Accounts Overview
    • Open an Account
    • Launch Web Trader

    Trading Specifications

    • Spreads and Commissions
    • Range of Market
    • Trading Hours
    • Funding
    • Withdrawal

    About IC Markets

    • Chat with a Specialist 24/7
    • Why IC Markets
    • Regulation
    • Legal Documents
    • Contact Us

    Disclaimer: This material is marketing material where all marketing material is published for informational purposes only. This material does not contain and should not be considered as containing - investment advice and recommendations, or suggestions for performing any actions with financial instruments. The built-in widgets belong to their external independent authors, and IC Markets is not responsible for their content and their impact on trade.

    All content rights reserved. Opinions of the authors may not coincide with the opinion of the blog editors. When copying materials from this site or connecting to an RSS feed to republish our articles, a link to IC Markets or attribution in the format ‘IC Markets Blog’ is required. For general questions, please contact the editorial office via the form on the Contact us page.

    Risk Warning: Trading Derivatives carries a high level of risk to your capital and you should only trade with money you can afford to lose. Trading Derivatives may not be suitable for all investors, so please ensure that you fully understand the risks involved and seek independent advice if necessary. A Product Disclosure Statement (PDS) should be considered before entering into a transaction with us.

    The contents of this page are general information only and does not take into account your personal situation, financial objectives or needs. It is up to you to make sure the products that we offer suit your specific needs. You should not trade with us unless you understand the features and risks of the products that we offer. This means that you might need to seek independent advice before you start trading with us.

    © 2022 Raw Trading Ltd | All rights reserved.
    • Sample Page